AWRI Outreach Program - Vessel Curriculum Guide

About the Program
Mission of the Vessel Program
The Robert B. Annis Water Resources Institute (AWRI) has a mission to integrate research, education, and outreach to enhance and preserve freshwater ecosystems. AWRI’s outreach program has been key to fulfilling that mission. The outreach program delivers a unique hands-on investigative experience to educate citizens about water, with special emphasis on youth. We offer experiential learning about water quality, aquatic food webs, and human impacts on water. Our ship-based research and learning laboratories connect citizens in West Michigan and across the Lake Michigan Basin with local, regional, and global freshwater ecosystems.
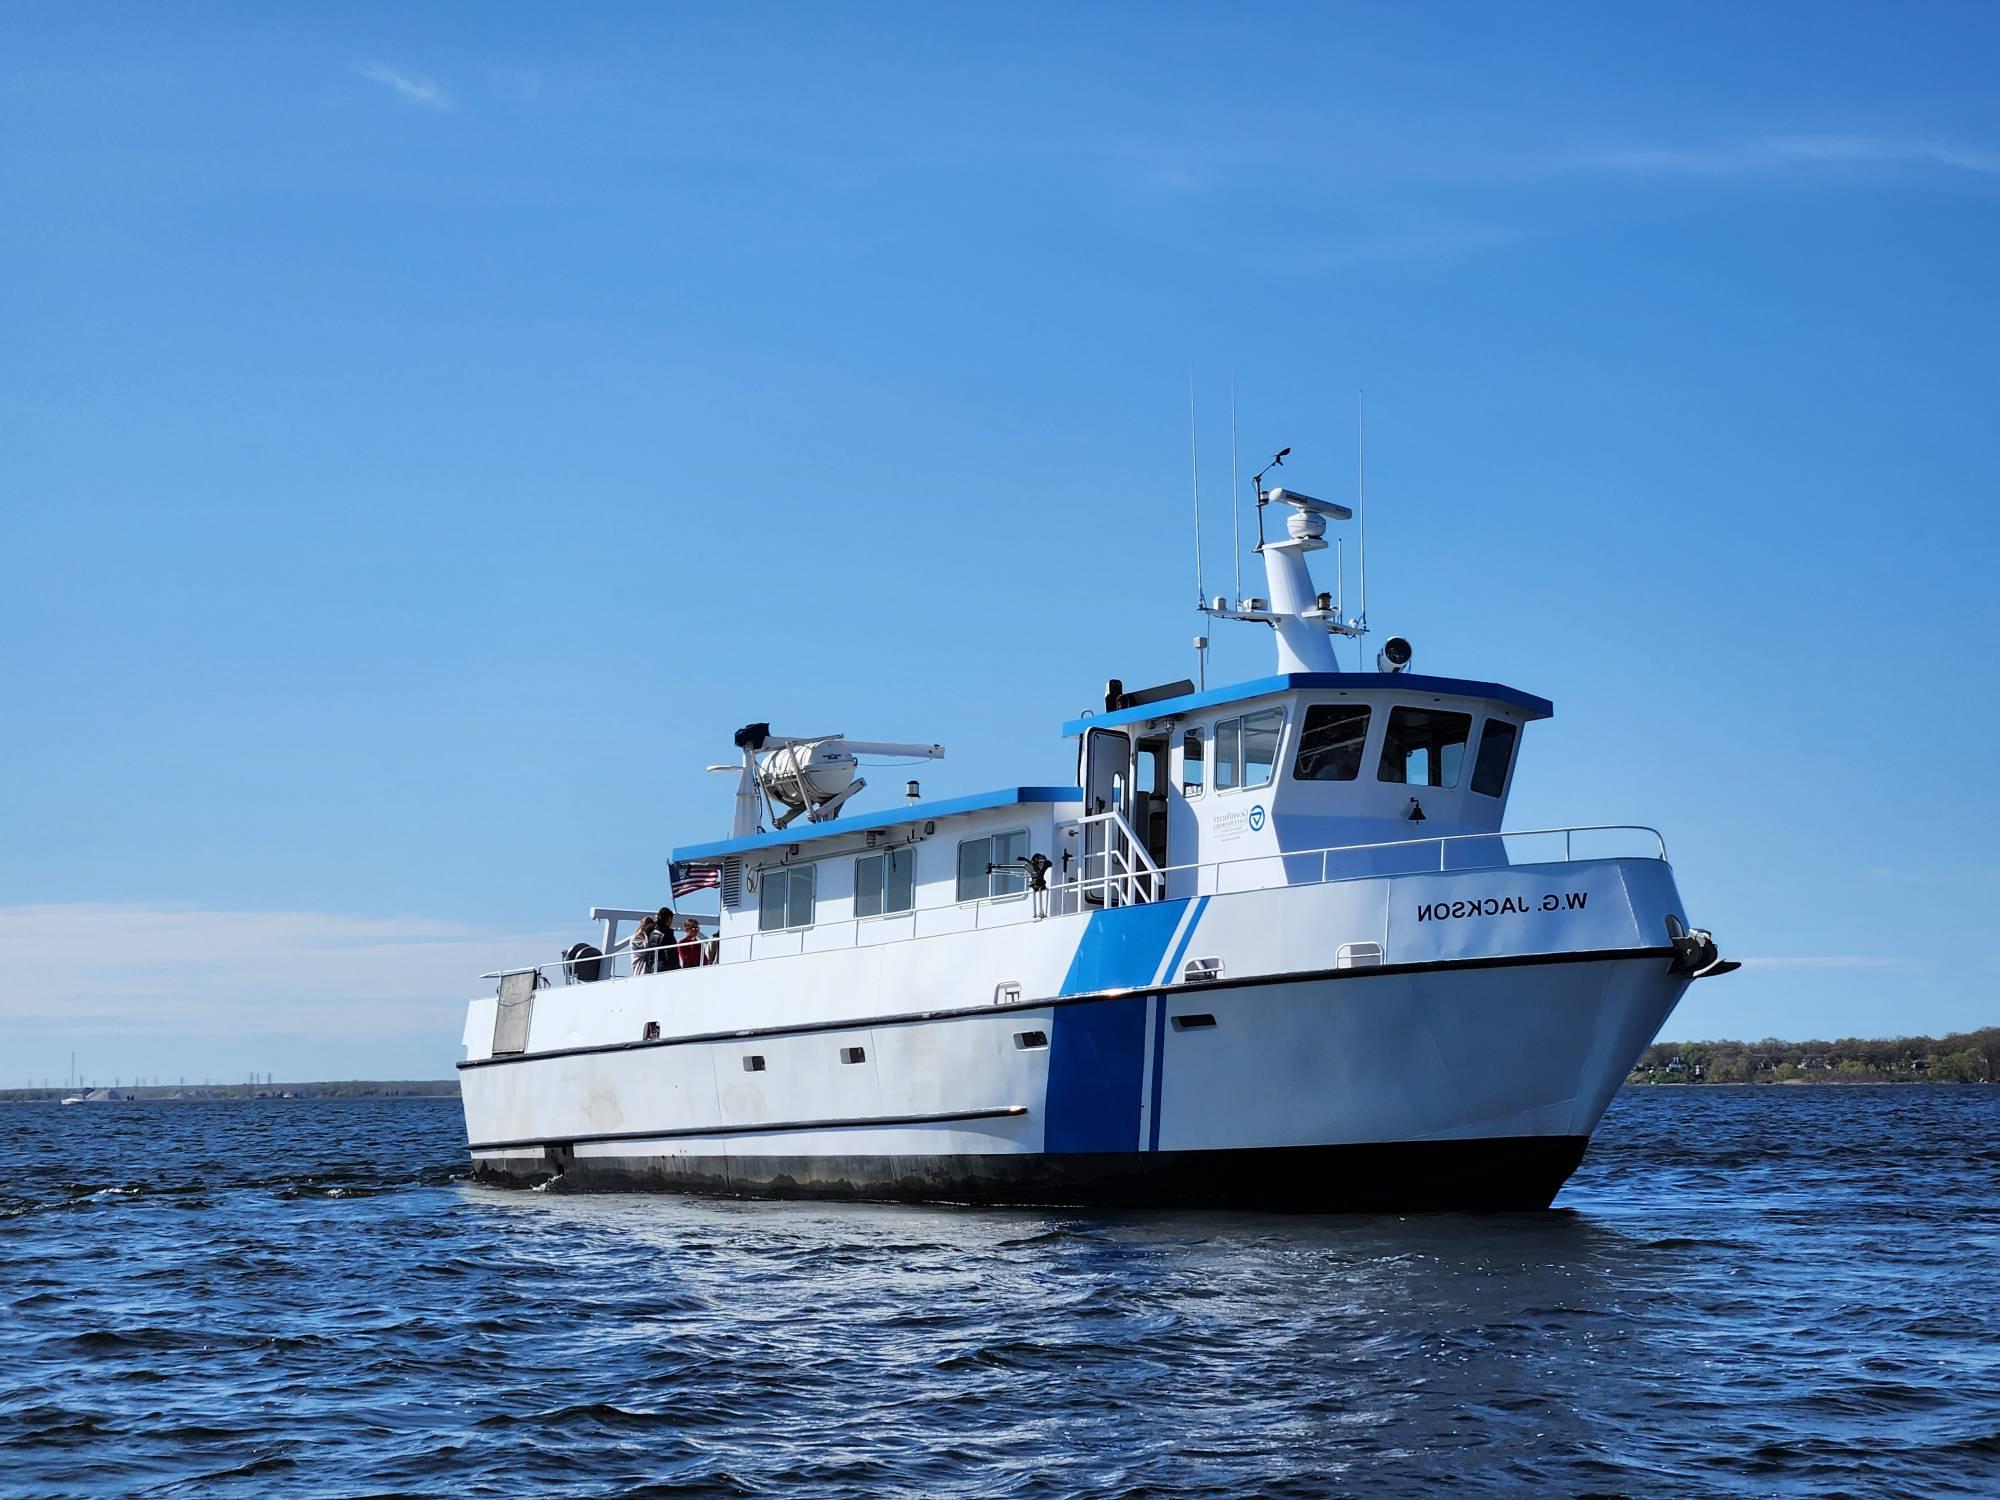
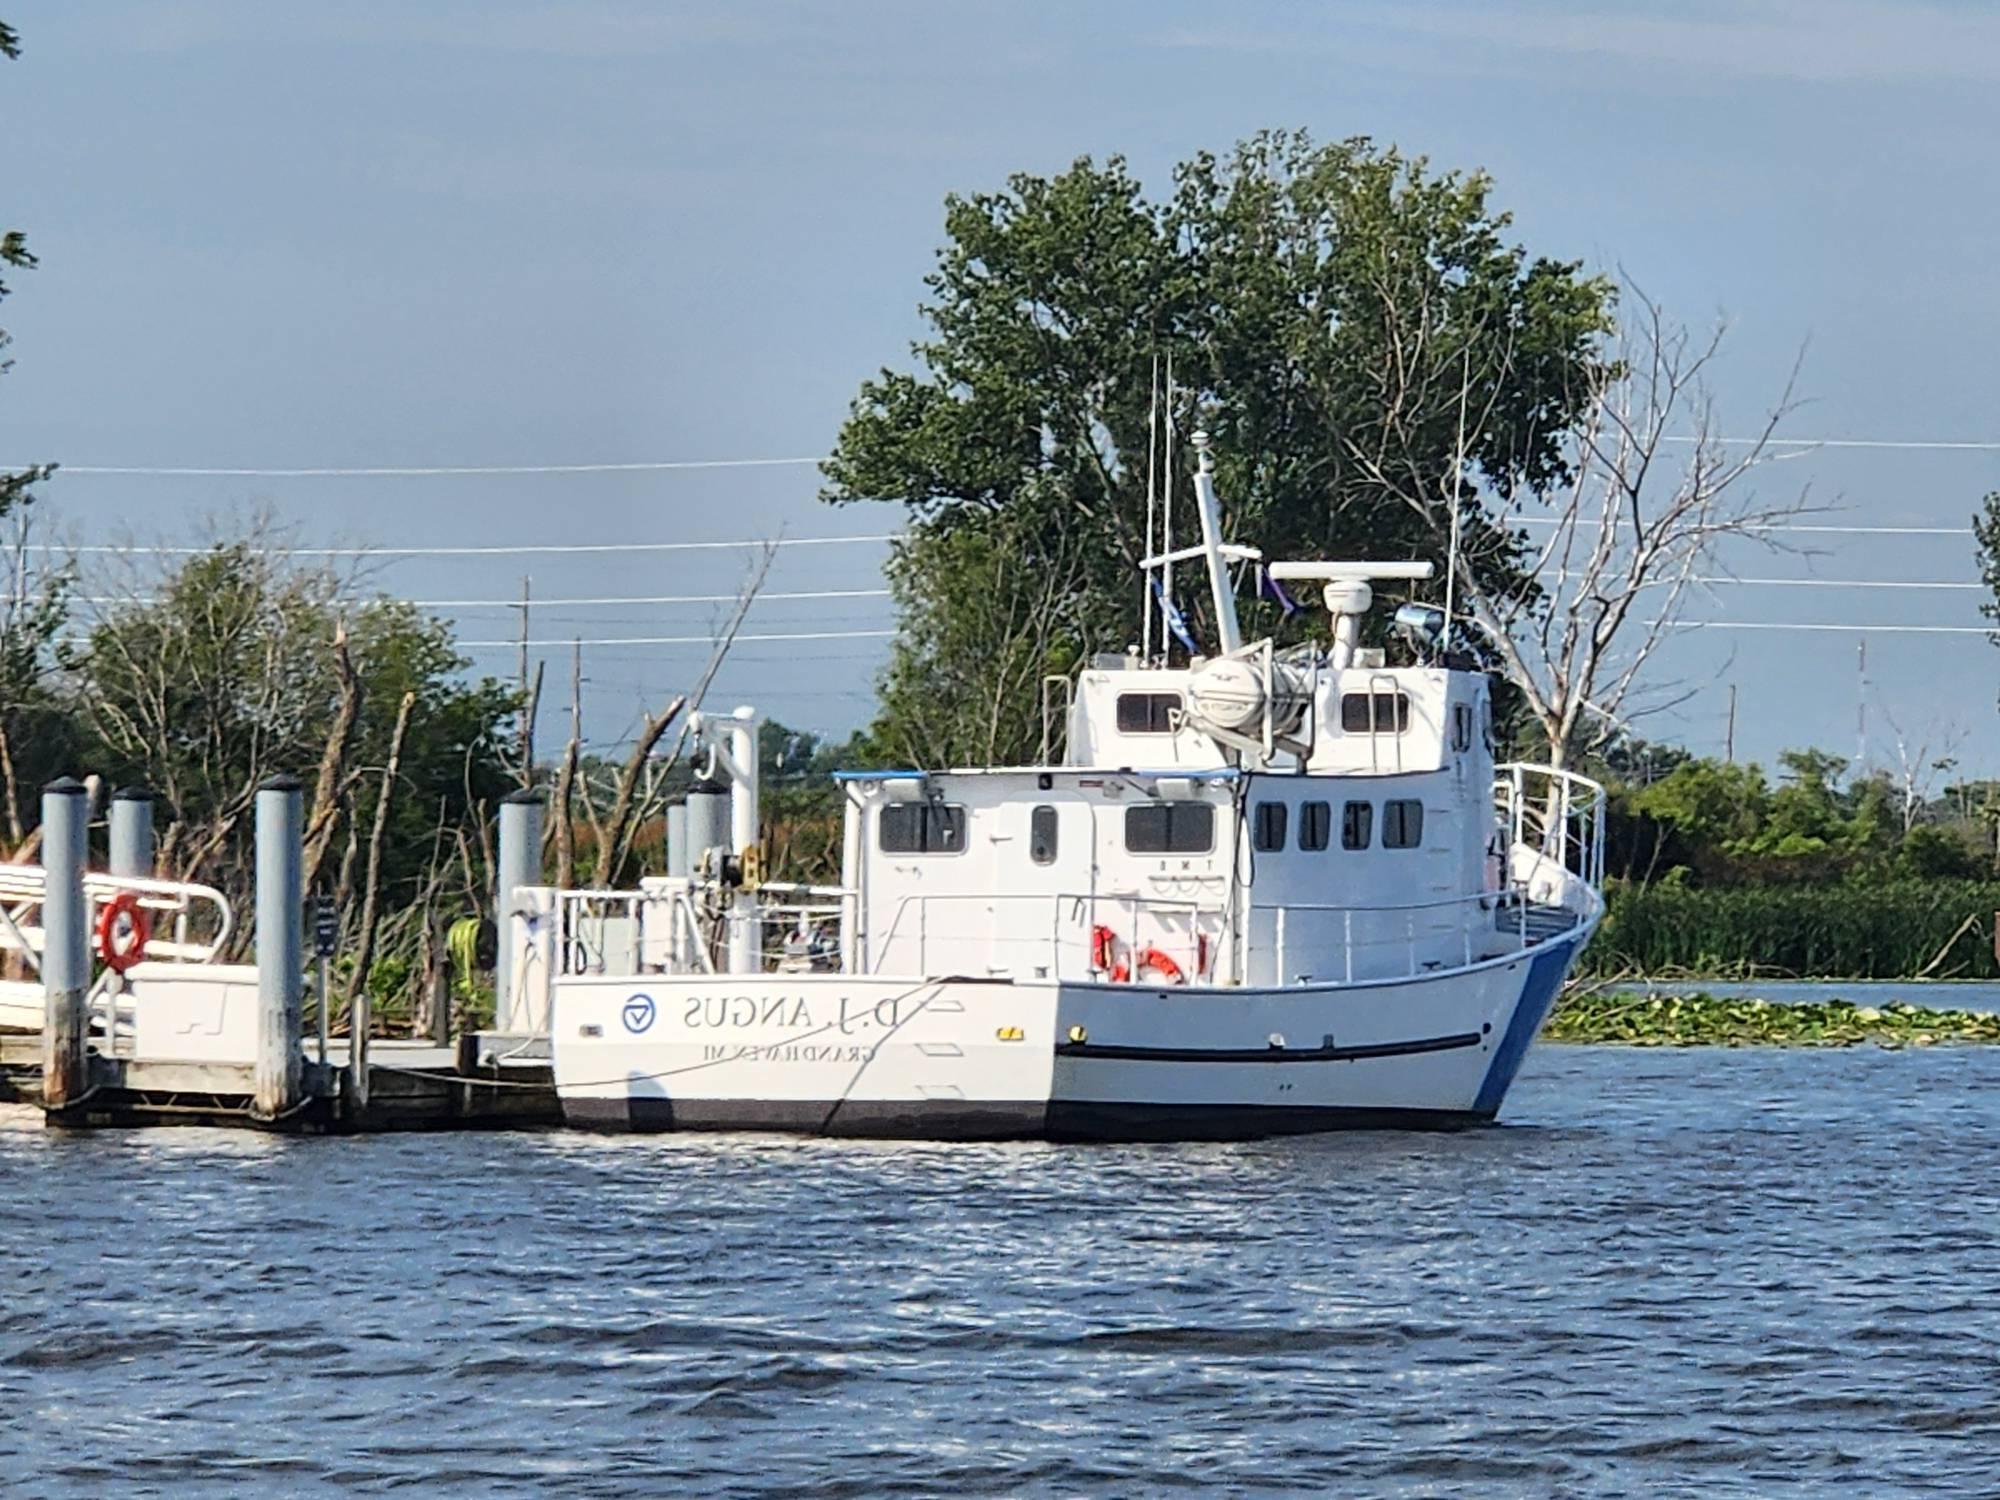
During an educational cruise, participants serve as freshwater scientists, collecting data and observations about the water bodies through which they sail. Since 1986, nearly 200,000 people have experienced hands-on science on Lake Michigan and adjoining waters through these programs. Offered onboard GVSU's research and education vessels D.J. Angus (docked in Grand Haven) and W.G. Jackson (docked in Muskegon), the program serves school groups as well as other organizations. Both vessels are used for AWRI research projects as well as the outreach program.
Learning Objectives of the Vessel Program
Through participating in an AWRI cruise, students will:
- Experience place-based learning on the water.
- Gain exposure to the process of science through hands-on testing, observation, and interpretation of data.
- Experience a sense of belonging in the field of freshwater science.
- Understand major physical, chemical, and biological characteristics of water, and ways to scientifically analyze and observe them.
- Articulate variables and conditions that can influence water quality characteristics.
- Identify the characteristics of oligotrophic, mesotrophic, and eutrophic lakes
- Detail how lakes differ in their characteristics, and what kind of ecosystems and human uses they can support.
- Discuss how human impacts (including invasive species) have impacted the Great Lakes and adjoining waterways.
- Name the watershed(s) that they sailed within, as well as in which they live.
- Describe the life cycle of key organisms (like midges, zebra mussels, and sea lamprey) and how they fit into the food web and larger ecosystem.

Big Ideas and Driving Questions
- How are different lakes and rivers similar and different in their physical, chemical, and biological characteristics?
- How do people use Michigan’s water resources?
- How do human activities influence the quality of lakes and rivers?
- How do aquatic ecosystems play an important role in terrestrial ecosystems, and vice versa?
- How do aquatic scientists explore questions about water quality?

Michigan Science Standards
A trip on the D.J. Angus or the W.G. Jackson is an excellent way for students to have an authentic STEM experience that supports the Michigan K-12 Science Standards. Our three-dimensional learning program integrates cross-cutting concepts and disciplinary core ideas with science and engineering practices. As students do the work of scientists, they collect, analyze, and interpret water quality data. They draw comparisons about different bodies of water to ascertain patterns, explore cause and effect relationships, and develop models of systems. Educators can easily build on their students’ experiences with AWRI programs through many links to their own classrooms. The Michigan-specific context of our programs stresses the unique location of our state in the Great Lakes basin, our water resources, human impacts on systems, and authentic scientific research.
Many other standards are touched on by our curriculum in less depth. If you need additional support in aligning our curriculum with standards for your grade level, please contact us.

Michigan Science Standards
The following standards are meaningfully covered on an AWRI science cruise:
4th Grade: 4-ESS2.2
5th Grade: 5-LS2-1, 5-ESS2-1MI, 5-ESS3-1
6th-8th Grade: MS-LS1-6, MS-LS2-1, MS-LS2-2, MS-LS2-3, MS-ESS2-4, MS-ESS3-3
Crosscutting Concepts: Patterns; Cause and Effect; Scale, Proportion, and Quantity; Systems and System Models; Energy and Matter: Flows, Cycles, and Conservation; Stability and Change, Interdependence of Science, Engineering, and Technology
Science and Engineering Practices: Asking Questions and Defining Problems; Planning and Carrying Out Investigations; Analyzing and Interpreting Data; Using Mathematics and Computational Thinking; Constructing Explanations and Designing Solutions
Vessel Curriculum Overview

Vessel Curriculum Overview
Preparation for a Cruise
During a cruise, many activities are happening at once, and students will be absorbing a ton of information about lakes and their environment. For some students, being on a boat is itself a novel experience, let alone engaging in new and challenging science activities. Participants will maximize their experience if they have been briefed on the activities prior to the trip. Safety handouts are provided during the cruise registration process. This information is essential for the group to prepare to have a safe and successful cruise. Lessons before and after a cruise on related topics will increase students’ familiarity with the topics and terminology covered on a cruise, helping them to deepen their learning and engagement with the topics.
Basic Overview
Whether groups are sailing on the D.J. Angus or the W.G. Jackson, they will have the opportunity to be aquatic scientists. Both vessels offer the same overall trip structure and curriculum, with place-based variations appropriate to their settings. In general, cruises illustrate the biological, physical, and chemical dynamics of water, and the interrelationships of rivers, inland lakes, and the Great Lakes. The onboard curriculum is structured around conducting water quality tests and other observations to compare and contrast Lake Michigan with smaller inland lakes and rivers.
The specific topics and depth of coverage vary with age level, and AWRI Science Instructors are prepared to adapt to the needs of the visiting group. The program serves school groups as well as other organizations. It can be customized for all ages from fourth grade through adults.
What to Expect on a Cruise
Upon arrival, AWRI Science Instructors will welcome the group and orient them to the vessel and its safety features and procedures. They will also provide an introduction to where the students are, the water bodies they are visiting, and what they will have an opportunity to do onboard that day.
On a typical 2.5 hour cruise, the vessel will stop at two locations (or stations) to take water samples, conduct analysis, and make observations. Stations are sampled and analyzed on a cruise for the purpose of comparing different bodies of water. Most cruises will do one station on Lake Michigan and one on a connected inland waterway (such as Muskegon Lake or Spring Lake). If Lake Michigan is too rough, the cruise will visit other areas of the inland lakes or rivers for the second station. Shorter cruises can be provided upon request, but two stations may not be possible during shortened cruises.
Every student will have an opportunity to work directly with multiple pieces of real science equipment to make measurements and observations at each station outdoors and inside the ship’s lab. AWRI Science Instructors provide students as many different experiences onboard as possible by giving new assignments at each station. For each test or observation, the instructors will orient participants to the water quality parameter being measured, the significance of this measurement to freshwater ecosystems, and the equipment and procedures to conduct the analysis. They will support the students in developing their comfort with the process of science and having success with their assigned tasks.
Topics Covered
While the vessel is sailing between stations, science instructors share information about a range of topics, including:
- Lake food webs
- Human impacts to water quality
- Restoration and environmental clean up efforts on local and regional lakes
- Invasive species
- Research conducted by AWRI scientists
- Landmarks and place features that the vessel is sailing by
- Shoreline structures and activities, and their potential influence on water quality
- Lake stratification and temperature profiles
- Climate Change and aquatic ecosystems
- Watersheds
- The significance of the Great Lakes and freshwater resources
Under the umbrella of freshwater science, particular topics can be emphasized within our curriculum upon request.
At the end of a cruise, the data collected over the course of the voyage will be analyzed and interpreted to make claims about what the data mean, and what conclusions can be drawn about the water that was sampled during the cruise. AWRI Science Instructors will facilitate review of data from each station and comparison of values from the different stations. Students will discuss actual versus expected values and trends, and practical applications of physical, chemical, and biological concepts. Instructors will answer questions from students as well as summarize key takeaways from the cruise.
Data Collection and Analysis
Students and teachers can take their data and/or plankton and water samples (upon request) back to the classroom for further study and discussion. The data from a group’s cruise can be analyzed further on its own, or in the context of other water quality data. The archive of data from AWRI cruises since 1986 is available online at http://9dap.eduftp.net/wri/education/vessel-program-data-archive-59.htm. As well, the Muskegon Lake Observatory provides real-time data from April to October for comparison: http://9dap.eduftp.net/wri/buoy/
Where We Sail
The W.G. Jackson leaves the dock at AWRI on Muskegon Lake and makes its way across the lake to Lake Michigan. Muskegon Lake is 4,149 acres or about 6.5 square miles in size. Many of the industrial areas along the shoreline of Muskegon Lake are being restored to pre-industrial conditions or re-developed. The area once had active logging and numerous industrial operations. Homes and marinas also surround the lake. Significant heavy industrial activity along with wastewater discharge, combined sewer overflows, and urban runoff in the past have led to contamination. In 1987, Muskegon Lake was designated an “Area of Concern” under the Great Lakes Water Quality Agreement. Through concerted restoration efforts since, the Lake is very close to being delisted and has much higher water quality today. The Muskegon River watershed drains into Muskegon Lake and influences the water quality. Besides Muskegon and Big Rapids, the watershed has no large cities and is relatively undeveloped.
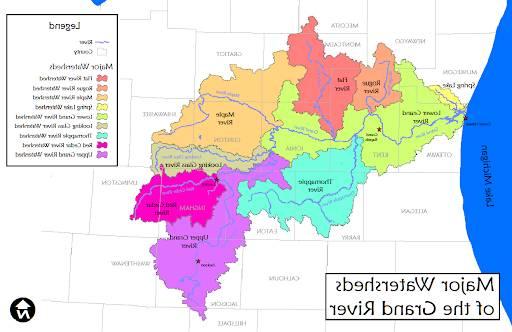
The D.J. Angus makes a trip to Lake Michigan via the Grand River. Along the route to Lake Michigan, there is a former sand mining operation, a large commercial unloading dock, marinas, and a former power plant. The headwaters of the Grand River are near the city of Jackson and the river also flows through the cities of Lansing and Grand Rapids. Besides urban areas, land use in this watershed is largely devoted to agriculture with relatively few natural areas. The other sampling point for the D.J. Angus is usually in Spring Lake, which is connected to the Grand River. Spring Lake is surrounded mainly by homes and has experienced elevated nutrient levels.
Lake Michigan has a surface area of about 22,300 square miles making it the third largest Great Lake. The flushing time of the Lake (or the average amount of time that water spends in the lake) is 62 years. The average depth of Lake Michigan is 279 feet with a maximum depth of 923 feet, making it the second deepest Great Lake. In contrast, Spring Lake's surface area is about 2 square miles with inputs of water mainly through springs, streams, and precipitation. Spring Lake is connected to the Grand River. Muskegon Lake is about 6.5 square miles in size, and it receives flow from the Muskegon River as well as tributaries such as Ryerson and Ruddiman Creeks.
Muskegon Lake

Spring Lake
Water Sampling and Water Quality Parameters
What is Water Quality?
Water quality is defined in terms of physical, chemical, and biological parameters with respect to a certain use. For instance, acceptable water quality for warm water fishes would not be optimal for cold water fishes, and standards for drinking water differ from those for boating and recreation. No single factor alone indicates good water quality, and water quality in a body of water can vary with the season and location. Long-term water quality measurements from well-defined locations are needed to tell if conditions are changing or remaining the same. Many of the procedures performed on the vessel help us to understand the quality of the waters being sampled.


Trophic Status of Lakes
One way of comparing lakes and evaluating water quality is by considering the trophic status or biological productivity. Eutrophication, or aging of lakes, progresses through various trophic states (oligotrophic → mesotrophic → eutrophic). Nutrient levels, organic matter content, dissolved oxygen levels, and water transparency give clues to the trophic state or biological productivity of a water body. A trophic scale has been specially designed for use on the AWRI vessels. By evaluating data from various parameters, sampling locations are rated as O (oligotrophic), M (mesotrophic), or E (eutrophic).
Oligotrophic lakes are characterized by low nutrient levels, low biomass, high oxygen concentrations, and high transparency. Oligotrophic lakes are usually deep. Eutrophic lakes are highly productive with high nutrient levels, high biomass, low oxygen concentration in the bottom waters, and low transparency. The large volume of organic matter accumulated in bottom sediments depletes oxygen as it decomposes. Mesotrophic lakes are between the other two trophic states in their characteristics. The open waters of Lake Michigan are oligotrophic and some nearshore areas are mesotrophic.
How Water is Sampled
The vessels use Van Dorn water sampling bottles to collect samples at various depths. These special bottles consist of an open-ended clear plastic cylinder that can be attached to a steel cord and lowered to any desired depth. A deckhand operates this equipment, but when conditions permit, will select 1-2 students to assist with this task. The bottles also contain thermometers to record the temperature of the water at the location of each Van Dorn bottle. Water samples from each bottle are taken into the ship’s lab for analysis. On a typical cruise, two Van Dorn bottles are used: one 1 meter below the water surface and one 1 meter above the lake bottom. This allows us to compare and contrast the characteristics of the top and bottom of the water column. On more advanced or longer cruises, a third bottle may be added to sample at half the station depth.
Summary of Water Quality Parameters
With every water quality parameter, participants will explore 1) what the parameter is, 2) why it is important for us to gather information on, 3) factors which influence it, and 4) how we are measuring it. Contextual parameters that could influence our readings are also recorded, such as percent cloud cover, wave height, water depth, wind speed, wind direction, and air temperature.
Chemical Characteristics of Water Quality
Chemical characteristics of water quality measured on the vessel include: pH, conductivity, dissolved oxygen, alkalinity, and nutrients.

The pH scale is a series of numbers ranging from 0 to 14 which denote various degrees of acidity. A natural body of water can be acidic, neutral, or basic. Many factors influence pH, including the composition of the material forming the basin holding the water, acidity of rain falling into the water, and the condition of water flowing into the body of water from streams, rivers, or storm runoff. A pH between 6.7 and 8.6 will support a well-balanced fish population, though different species prefer different pH values within this range. Very few species can tolerate pH values less than 5.0 or greater than 9.0. Lake Michigan water samples typically have a pH range of 7.0 to 8.6. A pH meter is used to measure pH on the vessels.
Physical Characteristics of Water
Physical characteristics of water quality measured on the vessel include: water clarity, water color, water depth, and water temperature.

How far can we lower the disk and still see the black and white pattern? Secchi Disks are used by scientists all over the world to measure water clarity. We see readings of 5 meters or more on Lake Michigan, but as low as .5 meters in Spring Lake. Readings also vary within the same lake depending on the time of year. For additional ways to measure water clarity, we also use a turbidity tube and a turbidity meter. Clarity, or transparency, tells us about how deep light can penetrate into the water, which determines how much photosynthesis can happen in a lake. Water clarity is related to amounts of suspended particles (turbidity) as well as phytoplankton and zooplankton.
Biological Characteristics of Water
Biological characteristics of water quality measured on the vessel include: sediment and benthic organisms and plankton.

On AWRI’s vessels, the PONAR grab sampler helps teachers and students explore the mysteries of West Michigan aquatic ecosystems firsthand, by taking a bite out of the sediment at the bottom of the lake and bringing it up for us to view. We can tell a lot about a lake by the kind of material the bottom is made of, and who is living in or on it. Muskegon and Spring Lake tend to have dark, mucky sediment, while Lake Michigan is sandy. Poking through the sediment looking for living organisms is the highlight of a cruise for many passengers. We often find bloodworms (the larval form of the midge fly), phantom midges, tubifex worms, biting midges, and zebra and quagga mussel shells (or infrequently, living mussels).
Additional Topics Covered on Cruise
Lake Stratification
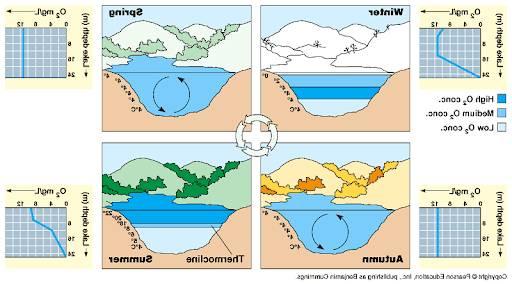
Temperature profiles sometimes show that the warm water surface layer often ends abruptly, with the temperature going rapidly from warm to cool, which is called a thermocline. The thermocline is the zone where there is a rapid temperature change, and thermoclines are observed when a lake is stratified. Lake stratification refers to the formation of distinct layers of water that do not mix with each other due to density differences. In temperate climates, many lakes are stratified during the summer, with large temperature differences between the layers of water.
As heat from the sun increases during the summer, the upper waters of the lake become warmer and lighter than deeper waters. One very important consequence of summer stratification is that circulation due to wind action is largely confined to the upper layer of water. Because the lower water mass is isolated from the atmosphere and receives little, if any, sunlight, dissolved oxygen is not replenished in this water mass. The dissolved oxygen may diminish to such a level that it limits aquatic life.
By contrast, in the fall and spring, the temperature of the lake is essentially uniform from top to bottom. This occurs when the power of the sun is reduced such that wave action on the surface will mix oxygen in the air with the water. The oxygen-rich water is driven down to lower depths, and the bottom oxygen-poor water will be brought to the surface where it can be replenished with oxygen. Turnover is also not uniform in a lake, and strong winds can cause upwellings where nutrient rich deep water moves towards the surface.
Muskegon Lake tends to follow this pattern. Since this occurs twice per year in spring and fall, these kinds of lakes are said to be dimictic; “di” meaning two and “mictic” meaning “to mix”. Because Spring Lake is shallow and a riverine system, the stratification breaks down several times throughout the summer. Every time this happens, the lake turns over. Since it mixes many times per year, we call it polymictic. Since Lake Michigan never completely freezes over, it technically only mixes once per year (fall), making it monomictic.
Climate Change
The Great Lakes and the region are influenced by larger climate change patterns affecting North America and the world. Global climate change caused by greenhouse gas emissions (such as carbon dioxide and methane) is well established by scientific study. Scientists expect that these atmospheric changes will result in increases in global air and water temperatures, extreme weather events and increased climate variability, and biotic changes. In the West Michigan region, increased variability in precipitation and changes in frequency and intensity of storms and floods are anticipated. A wetter climate is predicted, except during the summer where drier conditions are anticipated. We have already begun to observe some of these changes.
These global and regional changes influence lakes in many ways. Freshwater aquatic ecosystems are complex assemblages of species that have evolved over many thousands of years, and are particularly vulnerable to rapid changes due to climate change. Many of the parameters that we observe and test for on AWRI cruises will be impacted in different ways by climate change (see table below). Climate change also causes decreased predictability and increased uncertainty in how systems will respond to change.
Many of the most severe impacts of climate change can be mitigated if our society takes action now to reduce carbon emissions. We can also reduce the vulnerability of aquatic ecosystems to climate change by minimizing other pressures, such as reducing habitat destruction and restoring habitats, preventing the spread of invasive species, and sound stormwater management.
Potential Climate Change Impacts to AWRI Vessel Cruise Observations
| Parameter/Observation | Possible Climate Change Impact | Reason | Ecosystem Impacts |
|---|---|---|---|
| Alkalinity | Increase | Increased CO2 in atmosphere is absorbed by water bodies and can cause greater solubility of alkalinity sources. | Increased buffering capacity could provide greater protection from acid rain. |
| Benthic organisms | Variable changes | Life cycle changes to benthic organisms. Species will differ in how they respond to the water quality changes caused by climate change. | New invasive species introductions may become more likely as temperatures warm in areas where cold temperatures may have previously limited their range. New combinations of native and nonnative species will be interacting, with unknown implications for the food web. |
| Conductivity | Increase | Warmer water causes higher conductivity. Increased risk of pollutants entering water bodies during large precipitation events. | Increased conductivity can indicate a new source of pollution. Increasing salinity in freshwater has been a growing concern. |
| Dissolved Oxygen | Decrease | Warmer water holds less dissolved oxygen. Lake bottom water oxygen will be especially impacted during stratified periods. | There may be an alteration in the distribution of many fish species, which may make ecosystems more vulnerable to invasive species. The duration of summer stratification will increase, and algal blooms can cause hypoxic condition and fish kills. |
| Forel-Ule Color Scale | Variable changes | Increased plankton density may result in greener colors. Increased presence of filter feeding invasive species (e.g. mussels) have decreased the plankton density over time, resulting in bluer colors. | |
| Microscope observation of plankton | Variable changes | Changes in water quality parameters cause life cycle changes to fish, algal, and zooplankton. Growth rates should increase, but not at the same rate for each species. | Changes to food web and increased algal blooms, including harmful algal blooms |
| Nitrate and Phosphorus | Increase | Larger rainfall events can cause increased nutrient loading due to increased runoff and sewer discharge. | Increased algal blooms, including harmful algal blooms |
| pH | Decrease | Increased CO2 in atmosphere is absorbed by water bodies and causes increased acidification. | Species which prefer more basic waters will be constrained on their habitat. |
| Plankton Density | Increase | Algal growth may increase due to several factors, including shorter periods of winter ice cover, declining lake levels, and increasing water temperature. | Increased algal blooms, including harmful algal blooms |
| Secchi disk | Decrease | Increased sediment loading and plankton density will mean more shallow Secchi depths | Species which prefer clearer waters will be constrained on their habitat |
| Temperature Profile | Variable changes | Stratification dynamics in lakes will change in response. | The duration of summer stratification will increase, adding to the risk of oxygen depletion over greater areas and for longer periods of time. |
| Turbidity | Increase | Larger rainfall events can cause increased sediment loading. Declining lake and wetland levels may increase re-suspension of bottom sediments. | Species which prefer clearer waters will be constrained on their habitat. Decreased aquatic plant growth due to decreased light penetration. |
| Water temperature | Increase | Increased air temperature means increasing water temperatures and changed lake dynamics. | Plant and animal species responses will differ in response to changes in water temperature. Increased algal blooms, including harmful algal blooms |
AWRI Research Highlights
There are a dozen GVSU faculty members with labs at AWRI, who are doing research on a wide variety of topics within the field of aquatic science:
- Stuart Jones, Ph.D., AWRI Executive Director - Aquatic Ecology
- Bopaiah Biddanda, Ph.D. - Microbial Ecology
- Amanda Buday, Ph.D. - Conservation Social Science
- Sarah Hamsher, Ph.D. - Phycology
- Mark Luttenton, Ph.D. - Aquatic Ecology
- Jim McNair, Ph.D. - Ecological Modeling
- Ryan Otter, Ph.D. - Restoration, Pathogens, and Food Web Contaminants
- Charlyn Partridge, Ph.D. - Molecular Ecology
- Carl Ruetz, Ph.D. - Fisheries Ecology
- Alan Steinman, Ph.D. - Aquatic Ecology, Ecosystem Restoration
- Kevin Strychar, Ph.D. - Climatology
- Sean Woznicki, Ph.D. - Watershed Hydrology and Geospatial Analytics
